
Customer Service Metrics: The 8 That Matter for Small Teams
Field notes · Tactical
CS metrics that matter when you’re under 10 people
You read a customer service metrics guide and it hands you twenty-four KPIs. If you have three hundred agents and a workforce planner, twenty-four KPIs is a working dashboard. If you have six agents and a founder who reads the numbers on Sunday evening, twenty-four KPIs is noise.
Small teams do not have a metrics problem. Small teams have a decision problem. Which numbers, this week, are actually going to change what someone does?
The honest answer for a team under ten people is eight metrics – sometimes fewer. Each one has to earn its place by pointing at a decision. If the number moves and no one changes anything, that number is decoration.
This is the working set of customer service metrics small business teams can actually move. What each one measures, what it tells you, and the decision it points at.
The customer service metrics small teams should stop tracking (for now)
Before the working set, the list of metrics that make sense for larger operations but not for yours.
Cost per contact. This is a workforce planning number. Under ten people, your cost per contact is whatever your payroll adds up to divided by whatever your ticket count adds up to, and the number is unstable because your ticket volume is unstable. It tells you nothing you can act on. Revisit at forty people.
Utilisation. Same problem. Small teams have naturally uneven days. A utilisation number will read low on Tuesday and high on Thursday, and it will not tell you what to do about either. Revisit when you have shift patterns worth optimising.
Net Promoter Score. Not that NPS is wrong. It is that at small volumes, the sample size is too small to be reliable, and the customers who fill it in are the customers who already had strong feelings. It gives you a number that feels precise and is actually noisy. Revisit when your monthly response count exceeds a few hundred.
First-response-time SLA compliance. This is not the same thing as first response time. The SLA compliance metric is meaningful only if you have a written SLA in front of a customer contract. Most SME operators do not. Track the raw first response time instead – it is more useful.
None of these is a bad metric. They are just the wrong metrics for a small operation, because they do not point at a decision you are in a position to make.
The eight that actually move something
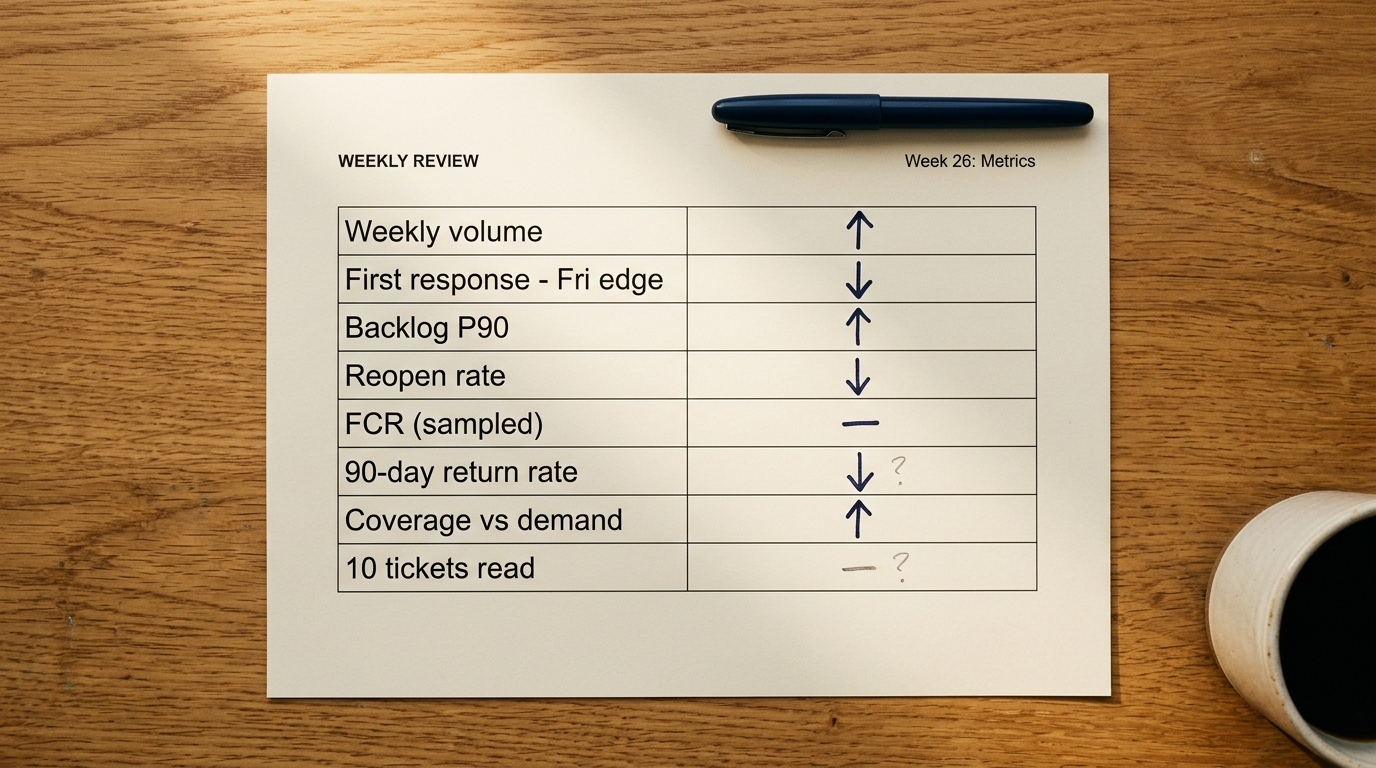
The working set of customer service metrics for a team under ten:
- Weekly ticket volume by channel. Points at capacity planning.
- First response time by channel. Points at coverage and shift shape.
- Backlog age (oldest ticket, and P90 age). Points at whether anything is being neglected.
- First-contact resolution, sampled honestly. Points at training gaps.
- Reopen rate (tickets closed and reopened within seven days). Points at whether “closed” is truthful.
- Return contact rate for the ninety-day cohort. Points at silent departure risk.
- Coverage: planned hours vs actual demand. Points at hiring and scheduling.
- A qualitative read of ten random resolved tickets, monthly. Points at everything the dashboard missed.
Number eight is the one most operations skip because it looks unstructured. It is the most valuable of the eight.
The principle underneath all eight is aligned with the international guidance for customer satisfaction measurement in ISO 10004:2018: monitor and measure with methods proportionate to the size and stage of the organisation. Twenty-four KPIs are the wrong instrument for a six-person team the same way a spectrograph is the wrong instrument for a smoke alarm.
Response time – which one, and when
“First response time” is the metric small teams reach for first, and the metric they most often get wrong.
The number that matters is not the average. Averages are dominated by the majority of tickets that respond quickly. The number that matters is the shape at the edges: the ninetieth percentile (the slowest ten percent) and the shape across the week (Friday evening compared with Tuesday morning).
If the average is thirty minutes and the ninetieth percentile is fourteen hours, you have an edge-case problem. It might be weekend cover, it might be a specific channel, it might be one agent’s queue. The average will not tell you which. The ninetieth-percentile shape will.
This distinction is small on paper and large in practice. The customers with a fourteen-hour reply are the ones writing reviews.
First-contact resolution, and the “was this resolved” question
FCR is the metric that can be gamed by anyone with access to the ticket close button. Under ten people, everyone has access to the ticket close button.
The version of FCR that is useful is not the automated one. It is a monthly sample. Pick twenty tickets marked “resolved on first contact” at random, read them, and count how many were genuinely resolved on first contact. The rate you find in the sample is the FCR that is real. The rate on the dashboard is the FCR that has been reported.
The gap between the two is the training gap. Close it by walking through examples with agents in a weekly review – not by adding a new metric.
This is the same discipline that runs through the four-gap customer service audit: look at what closed, not just what the dashboard reported closed.
You do not have a metrics problem. You have a decision problem.
CSAT vs the tickets you never see
CSAT is the metric small teams most want to track and the metric least likely to be useful at small volumes.
The problem is selection bias, and it is worse at small scale. The customers who fill in a CSAT survey are disproportionately the ones with strong feelings. In a large operation, that is a fixed bias you can work with. In a small operation, three angry customers can move your monthly CSAT by five points, and you will not know whether the score is a signal or a coincidence.
There is a broader research point here. Nielsen Norman Group’s analysis of user satisfaction versus performance metrics across nearly three hundred studies found that satisfaction scores and objective performance agree only about seventy percent of the time. Thirty percent of the time, what the customer says and what actually happened do not match. A single-number satisfaction score, at small sample size, is measuring something noisier than it looks.
The tickets you never see – the ones that closed cleanly and did not get a CSAT – tell you more, in aggregate, than the tickets that did. Read the closed tickets. That is your real satisfaction data.
CSAT is worth collecting anyway, because it costs almost nothing to include the question. It is just not worth acting on until the sample size is meaningful.
The metric that predicts next quarter
The customer service metric that predicts the next quarter’s health, for most small SME operations, is backlog age – specifically the oldest ticket and the P90 age.
If the oldest ticket in the queue is growing week on week, and the P90 is drifting up, the operation is falling behind and does not know it yet. Ticket volume will look fine. First response time will look fine. The queue is slowly growing a tail, and the tail is where trust dies.
Watch the tail. It moves before the leadership number does.
The uncomfortable observation
Under ten people, the customer service metric that matters most is the one that is hardest to automate: a founder or lead reading ten random tickets a month, in full, without picking them.
Everything else on the dashboard is downstream of that discipline. The dashboard tells you what happened in aggregate. The tickets tell you what actually happened to specific customers. If you only read the dashboard, you will optimise for the numbers that are easy to move. If you also read the tickets, you will optimise for the customers.
The eight metrics above are the working set. The tenth ticket you read this month is the one that will change what you do.
Where to start
Small teams have different metric requirements than large operations – not fewer, different. The eight above are the working set for teams under ten. When the operation grows past ten, the shape changes; more metrics start earning their place, and the review cadence shifts too.
Both configurations are set out in the Metrics Dashboards – Solo 8 for teams under ten, SME 24 for teams growing past that. Each metric is defined, the calculation is written out, and the decision each number should trigger is spelled out. So a Sunday-evening review takes ten minutes, not an afternoon.
Get the Metrics Dashboards
Two working dashboards – one for teams under ten, one for growing SME operations – with each metric defined, calculated, and paired with the decision it points at. No twenty-four-KPI overload; just the numbers that move a decision.
See the Metrics Dashboards →